
|
|
North American Regional Climate Change Assessment Program
|
|
 Home
Home
 Results
 Experiment 0
 Validation Data
|

|
|

|
|

|
|
Validation Data
|
|
|
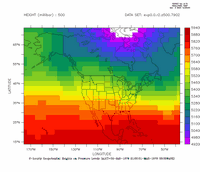
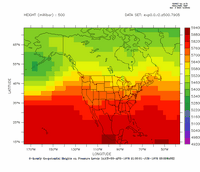
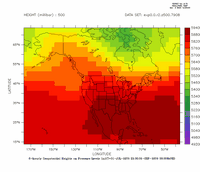
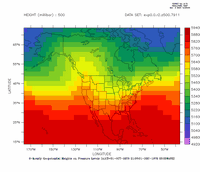
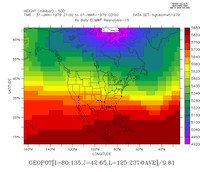
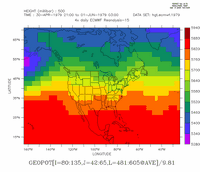
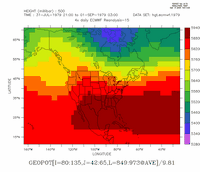
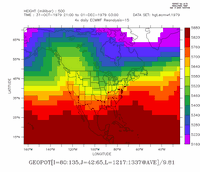
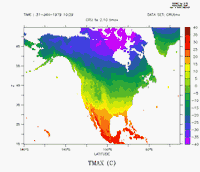
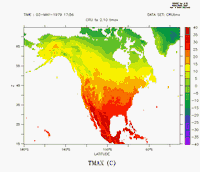
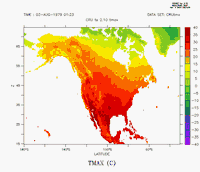
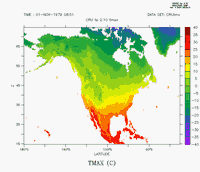
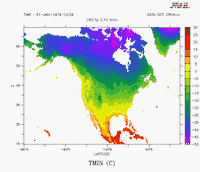
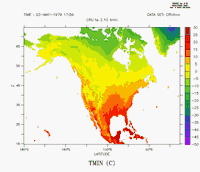
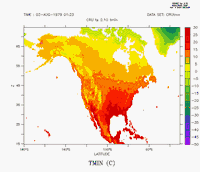
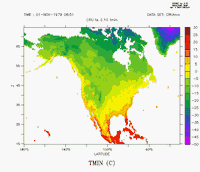
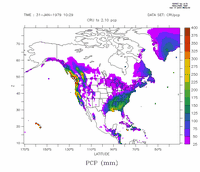
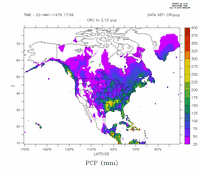
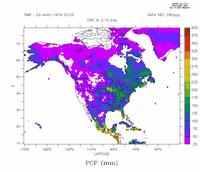
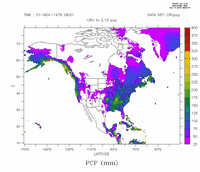
Validation data are plotted on its native grid. The coarseness of the shaded
grid cells reflects the resolution of the data. To view a full image in a new browser, click on the thumbnail image.
| |
February
1979 |
May
1979 |
August
1979 |
November
1979 |
500 Z:
NCEP/DOE Reanalysis-2 |
 |
 |
 |
 |
500 Z:
ECMWF-15 Reanalysis |
 |
 |
 |
 |
TMAX:
CRU TS2.10 |
 |
 |
 |
 |
TMIN:
CRU TS2.10 |
 |
 |
 |
 |
PCP:
CRU TS2.10 |
 |
 |
 |
 |
|
|
|
|
|
©2007 UCAR | Privacy Policy | Terms of Use | Site Map | top of page |
|
The National Center for Atmospheric Research is
sponsored by the National Science Foundation. Any opinions,
findings and conclusions or recommendations expressed in this
material do not necessarily reflect the views of the National
Science Foundation.
|

