North American Regional Climate Change Assessment Program
    Home Results Scatter Plots WestBoreal
 
  PROGRAM
About NARCCAP
About Data
Contact Us
  RESOURCES
For PIs
For Users
    Access Data
  User Directory
  Contributions
  Acknowledgements
  RESULTS
Output Data Catalog
General Results
    NCEP-Driven RCM Runs
Climate Change Results
CRCM+CCSM
CRCM+CGCM3
ECP2+GFDL
ECP2+HadCM3 NEW!
HRM3+GFDL
HRM3+HadCM3
MM5I+CCSM
MM5I+HadCM3 NEW!
RCM3+CGCM3
RCM3+GFDL
WRFG+CCSM
WRFG+CGCM3
  SPONSORS
 
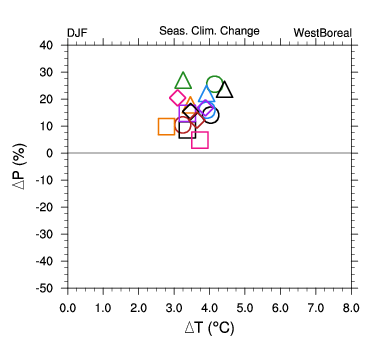
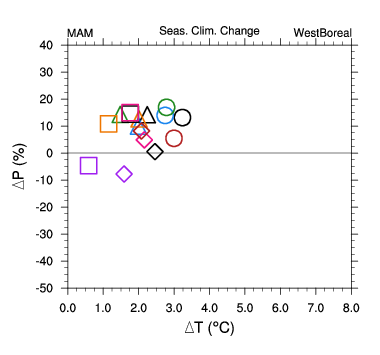
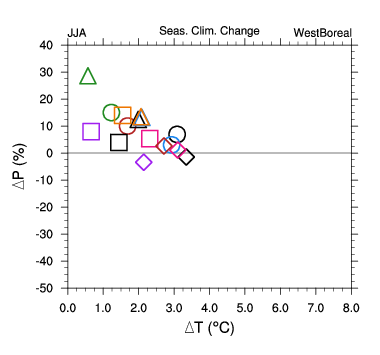
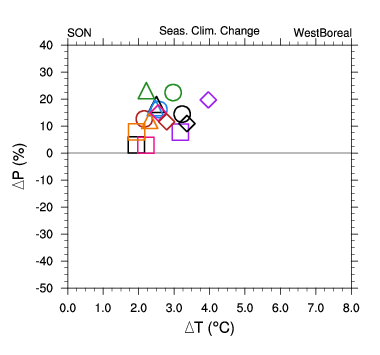
Regional Climate Change Scatter Plots: WestBoreal
 

These figures show scatter plots of seasonal average change in temperature and precipitation over the WestBoreal Bukovsky region for all available RCM-GCM combinations and the corresponding AOGCM runs.

Index of regions

WinterSpring
SummerFall

For printing: PostScript versions of these plots.

 
©2007 UCAR   |   Privacy Policy   |   Terms of Use   |   Site Map   |   top of page    
The National Center for Atmospheric Research is sponsored by the National Science Foundation. Any opinions, findings and conclusions or recommendations expressed in this material do not necessarily reflect the views of the National Science Foundation.